A common thing I need to do at work is paste a small table into an email or presentation.
I’m a bit picky with formatting. I wanted to be able to control shading, borders, and number formatting ($, comma separators, %, # of digits).
I can do that really, really quickly in Excel. I haven’t found a quick way to do all of that in R. (see discussion here: https://community.rstudio.com/t/output-nice-looking-formatted-tables/1084)
Don’t get me wrong, there are lots of options, and I use some of the stuff mentioned in that discussion - especially when it’s going into a script that gets routinely re-run (e.g. monthly updates). But for a one-off analysis, it’s often way less work to paste it into Excel, click some buttons and paste the result as an image so it looks like I want it to look.
Eventually I caved in and made a snippet in RStudio. I pipe the results of my table-making into the snippet, hit ctrl-V in Excel, format, then copy as image (I put that on the quick-access toolbar).
snippet clippy
        write.table(${1:.}, file="clipboard", sep="\t", row.names=FALSE)
In use:
mydata %>%
    group_by(event_year, office) %>%
        summarise(caseload = sum(cases)) %>%
        mutate(perc_tot = caseload / sum(caseload)) %>%
        select(-caseload) %>%
        spread(office, perc_tot) %>%
  write.table(., file="clipboard", sep="\t", row.names=FALSE)
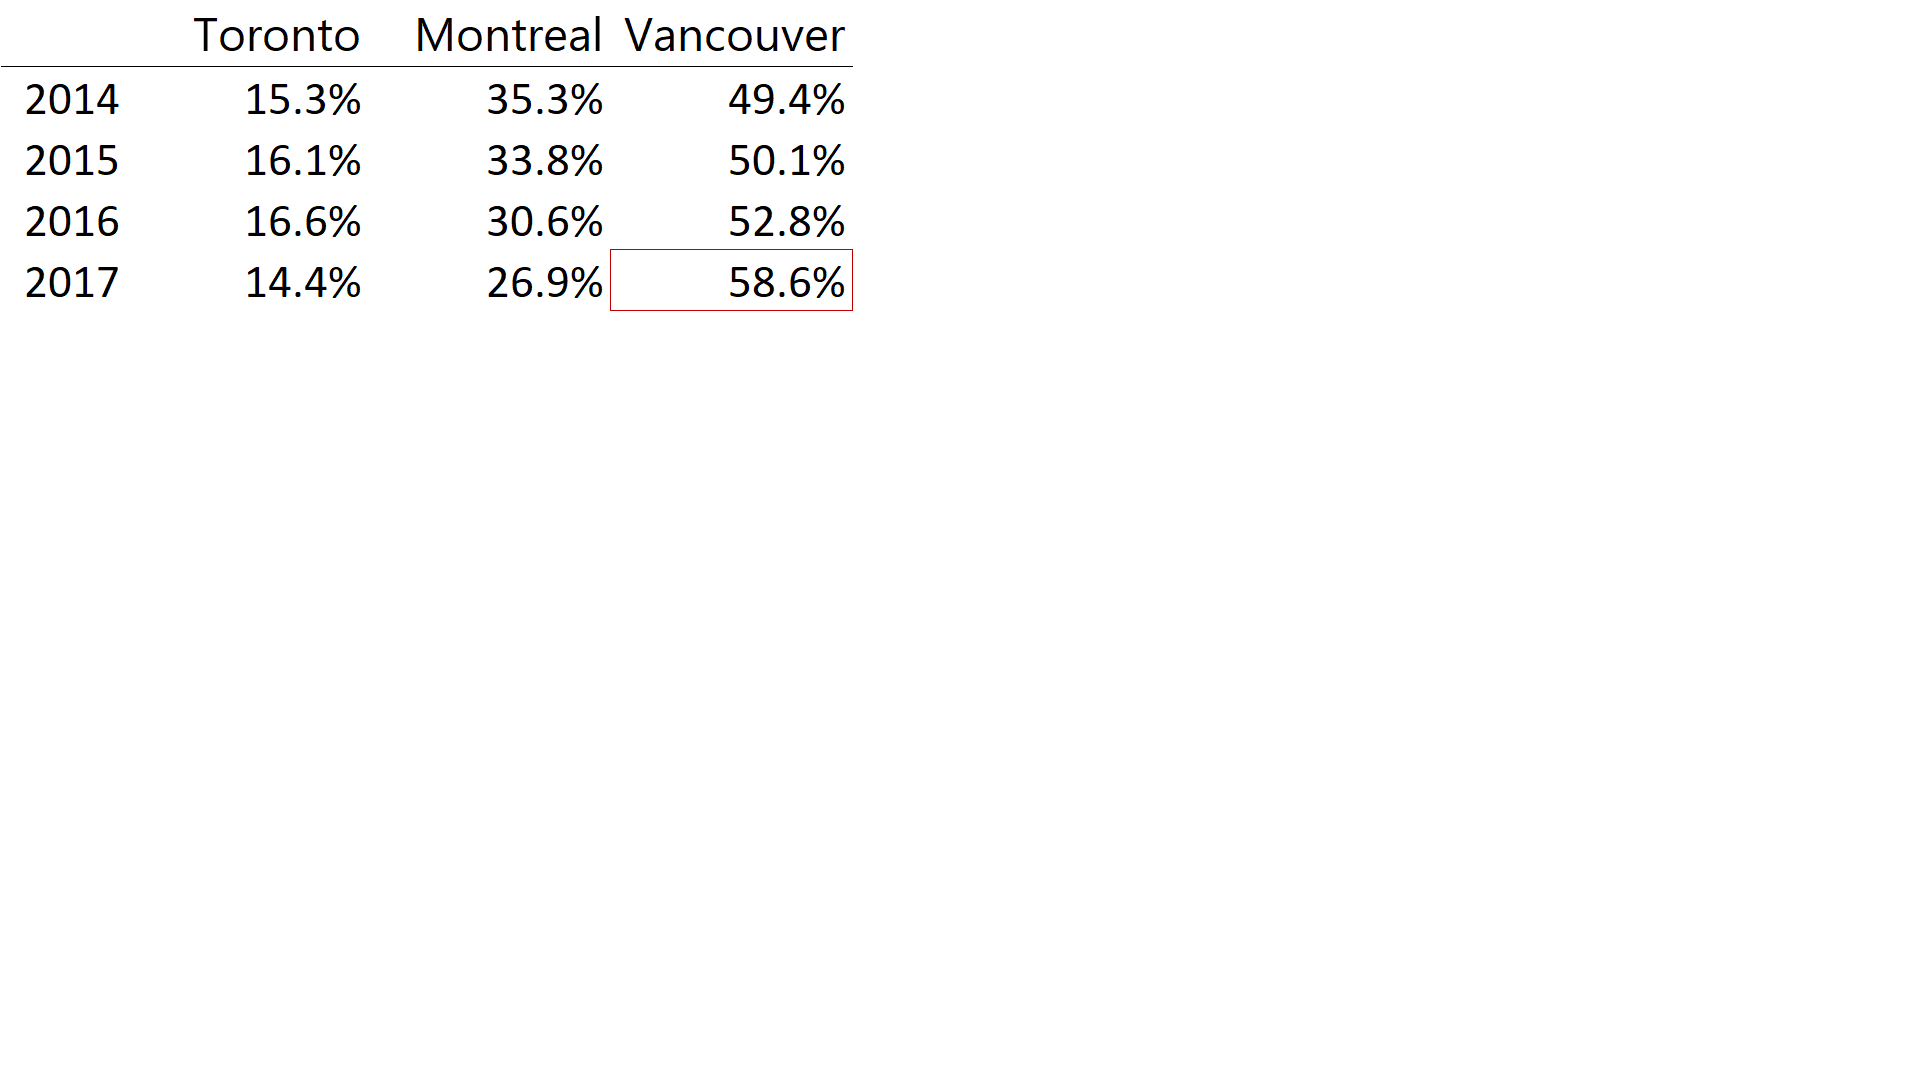
The result:
